Dashboard Consulting

Explore Your Data
Develop Insights
Improve Performance
Much like vehicle dashboards, data dashboards display real-time key metrics and performance indicators, to guide your business decisions and action. Let Blast help show you the way.
Get the Answers You Need
Asking the right questions and then gathering, organizing, and presenting data to make informed decisions is not a trivial task. The ability to clearly see how you’re performing compared to goals and objectives, prior year performance, competitors, or industry standards enables you to make sound decisions and follow up with more questions that will help your company EVOLVE.
How Dashboards Help
More and more organizations are turning to dashboards as a way to quickly understand and analyze their data. After all, the ability to transform your data into a dashboard that clearly identifies issues and opportunities requiring attention or action are invaluable to any company seeking to improve.
Stephen Few, a well known teacher, consultant, and innovator in the field of business intelligence and information defines a dashboard as “a visual display of the most important information needed to achieve one or more objectives, consolidate, and arranged on a single screen so the information can be monitored at a glance.”
Benefits of Dashboard Consulting
Done correctly, transforming your company’s data into dashboards will result in the ability to:
- Quickly identify performance towards goals and objective
- Clearly point out that something deserves attention
- Pinpoint what action needs to be taken
- Make unexpected discoveries
- Build informed decisions based on facts
- Improve your company performance
Click below to view an interactive sales dashboard example.
Using the dashboard consulting example above, you can quickly see:
- Current Year Sales and Profit are better than both Budget and Prior Year Sales and Profit. In addition, text indicates how much better Year to Date Sales or Profit are than Budget and Prior Year.
- The Technology category is not meeting its Sales goal, though it is only off a little; however, Office Supplies is doing much better than its goal.
- The East Region is missing its Sales goal by about 50%, whereas both the Central and West Region are well above their goals.
- Profit for all categories is on target, with Office Supplies exceeding its goal by at least 50%.
- The East and South Region are not meeting their Profit Goal, but both Central and West Regions are significantly above their goals.
- There is a clear list showing the top five Customers and Products based on Sales and the lowest five Customers and Products based on Profit.
Using the information provided by dashboards, executives and management can quickly focus on the areas requiring attention and learn from the areas that are exceeding expectations.
Dashboard Expertise Delivered by Blast
 Blast dashboard services can help your company get a solid handle on your data so that you can begin to develop insights, answer questions, and make better-informed decisions with dashboards. The size of your company and source of your data (e.g. spreadsheets, .csv files, databases, data warehouse, etc.) doesn’t matter, as we have a solid team of analysts that can quickly help you:
- Connect to your data
- Explore, analyze, and visualize your data
- Choose dashboard design (e.g. tactical dashboard, operational dashboard, executive dashboard)
- Develop insights
- Share and act on results
Dashboard Tools We Work With:
Google Data Studio
Transform data into clear, informative reports that are easy to read, easy to share, and fully customizable (free version or Data Studio 360)
Domo
Easily view and consume your business data in real time via cloud-based SaaS software on any device
Top Companies Hire Us
Are you interested to know who we’ve recently helped with dashboards? Many world-class organizations trust Blast to gain a solid understanding of their data and create business intelligence dashboards that have improved their ability to manage their company. Below are just a few of our recent clients:

Case Study
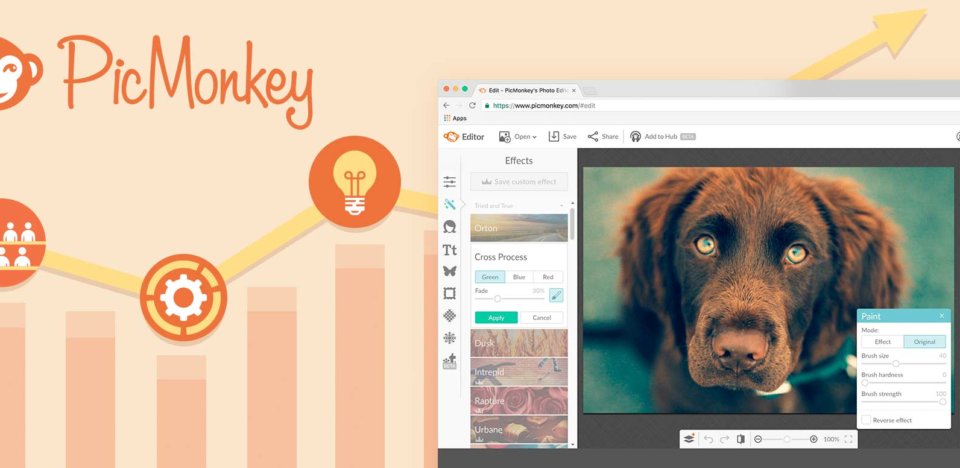
PicMonkey
For a subscription business to succeed it must grow its subscriber base. Find out how we helped PicMonkey grow by defining their KPIs as well as implementing report automation and dashboards, to provide real-time insights into their key metrics.Interested in Data Visualization?
Learn how our data visualization services can help you answer your business questions and proactively optimize your organization.
Looking for analytics consulting beyond dashboards?
Take a look at the analytics services offered by our analytics consultants.


