Analytics Blog

Google Analytics Focuses on Shopping & Merchandising Analysis (Part 3)
Ecommerce Reports Now Give A Better Picture of the Real World
In this third post in our 4 post series on Google Analytics Enhanced Ecommerce reports, we take a look at three reports — the newly revised Product Performance and Sales Performance reports, as well as the brand new Product List Performance report.
After reading, you should take away the following points:
- Reports are more focused on revenue…finally!
- Reports now include Product Returns and Refunds…hooray!
- Reports have an increased ability to determine which products are bought from the detail page rather than the category page
- Reports now allow you to logically group products into Product Lists and track performance of the entire list
- eCommerce Reports can be creatively used to track non-commerce site activity
Ready to dig-in?
What’s New in Revised Product Performance Report
When I compared the new and old Google Analytics reports side-by-side, I immediately spotted several changes.
To start with, there are two groups of columns, Sales Performance and Shopping Behavior.
Sales Performance Columns
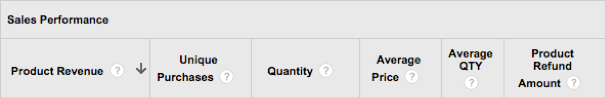
The first three columns show me Revenues, Unique Purchases, and Quantity – in that order. This is a welcome change from before where the report displayed metrics by Quantity, Unique Purchases, and then Revenue. This change seems to be consistent with other enhanced ecommerce reports where the first column now highlights revenues.
Key Takeaway: Reports now wisely focus more on revenues
A new and highly valuable column has appeared for the first time in this report – Product Refund Amount. Returns and refunds have always felt like an area we’ve missed from an analytic perspective and we’re excited to see them popping up here.
Key Takeaway: Integration of Refunds and Returns can provide a more realistic picture of your financial results.
Shopping Behavior Columns to Drive Insight
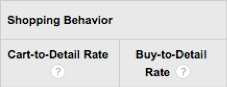
The next two NEW columns show me something very informative.
- First, the Cart-to-Detail Rate (the times a product is added to a cart divided by the number of times a detail page is viewed). If you recall from previous posts in this series, our client’s site doesn’t get a lot of detail product views, as the “Add To Cart” from the category page is highly used and visitors do not often drill down to a detail view. However, we do find this figure valuable, and we use it as a metric to determine which individual product detail pages might need to be improved.
- Second, the Buy-to-Detail Rate (the times a product is purchased divided by the number of times a detail page is viewed) is again a great metric. Comparing these two together side-by-side is a marvelous wealth of product insight.
Key Takeaway: Two new insightful shopping behavior metrics allows for greater insight into individual product performance.
Before jumping into the Sales Performance report, I want to point out one additional NEW link and report. Product Brand is a new dimension; and a new link exists to show you the same metrics under the Product Performance report section. Although, here we can see information sorted by brand.
![]()
If we are sending these new dimensions to Google Analytics while the visitor is browsing a product, a logical extension is to utilize the power of Custom Dimensions and add new fields to capture Product Weight, Product Size or Product Variation. Having these additional dimensions might make for some interesting custom reports.
Important Tip: Don’t forget to set up these new custom dimensions with the “Product” scope.
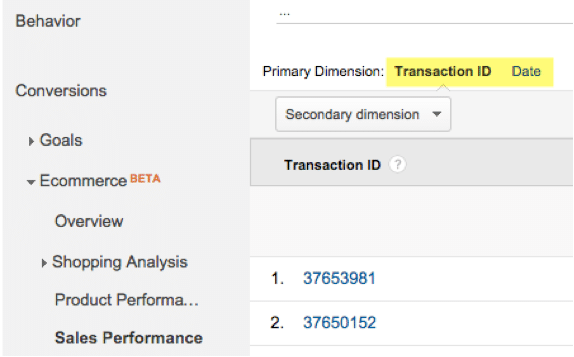
What’s New in Revised Sales Performance Report
When I look at the revised Sales Performance report I see the first view is by Transaction ID, and I also now see that the new main navigation menu on the left no longer contains a link to “Transactions.” Aha! The Transactions report is now shown as the Sales Performance report with Transactions as the first primary dimension; Date has taken second place as an optional primary dimension.
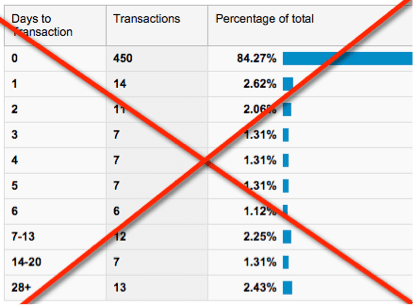
The odd percentage of revenue graph is now gone:
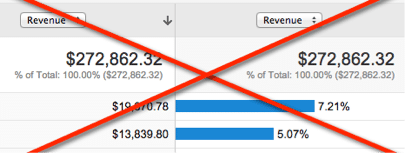
This has been replaced with the columns used in the previous Transactions report. Now shown across the top are:
- Revenue (depending on implementation, it may include tax & shipping),
- Tax,
- Shipping,
- Refund Amount,
- and Quantity metrics.
![]()
Before moving on and examining the NEW Product List Performance report, note that the Time to Purchase reports are no longer in the menu.
Key Takeaway: Many people found the deleted Time to Purchase reports misleading due to the “Days to Transaction” not reflecting the time from the start of this visit, but instead being the time from the start of the most recent campaign.
Overall to my eye, the selection of reports now feel cleaner and more consistent.
New Product List Performance Report
Now you can track performance of product lists that you create. The list could be as simple as all products in a given category, the results of a search yielding several matching products, or even mini-lists that get generated dynamically at the bottom of another product’s detail page, such as a “Customers who purchased this product also liked…”
Also it is interesting to note that any given product could have a position within a list (position 1 being the first product and so on).
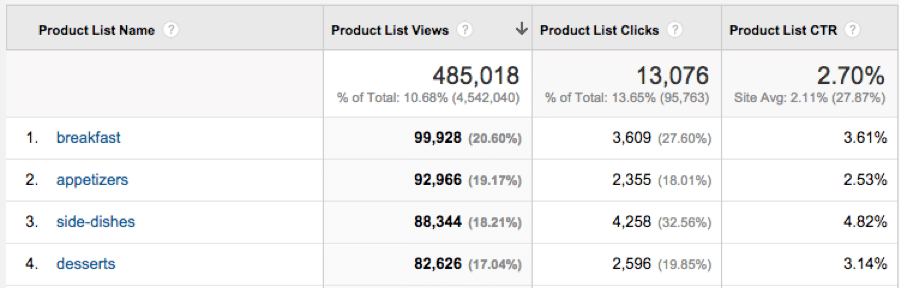
When our client’s visitors click on a main navigation link like “breakfast,” the page will display the list of breakfast items for sale. This is sent to Google Analytics as a product list view. When the visitors clicks to add any product to the cart, or to drill down to view more detail, the click gets registered both as a product view and a product list click action.
Let’s take a closer look
Looking at a select group of products I can at a glance see which menu items are viewed more often by the Product List View metric. Then I can also see which products are more often clicked.
Either by the:
- click count
- or the click through rate (CTR).
On this product list performance report, I can select primary dimensions other than Product List Name (default) like:
- Product List Position,
- Product,
- and Product SKU.
When I select the Product List Position as the primary dimension, I will be able to see the effectiveness of how products perform given a specific position within a list. Of course, at the moment many positions are static, and the numbers seen reflect this.
Actionable Insight & Potential Action: It does make me want to begin some experimenting with new lists and altering positions within the list to do some specific product placement tests.
Using Ecommerce Module for Non-Commercial Sites? Yes, you can.
Say your site is a blog, and you don’t sell a thing.
You can still now specify checkout steps that form the basis of a content-focused conversion funnel where the Product Category represents an author and a transaction is counted when the user +1 or likes your article.
If you are curious about how your site can take advantage of these new ecommerce reporting features and you’re ready to take the next step, contact our team at Blast Analytics & Marketing.
Next Up
The next set of Google Analytics ecommerce reporting features I’ll be covering in my final blog post will be the new, “Marketing Reports.” Stay tuned!
Related Insights

Digital Analytics


User Privacy


If you have questions or you’re ready to discuss how Blast can help you EVOLVE your organization, talk to an Analytics Consultant today.
Call 1 (888) 252-7866 or contact us below.


