Analytics Blog

Transform Your Business Goals Into a Powerful Analytics Strategy
When I was a kid my best friend lived on the edge of a forest. Countless hours were spent exploring and forging our own paths to favorite spots. The thing we wanted more than anything was to build the perfect fort. Armed with a hammer, a few sheets of plywood, a hand saw, and some nails, we thought we were destined for greatness. But architects we were not and despite our best efforts our fort was about as sturdy as one made of blankets.
Now I’m not saying a Bachelor of Architecture or a well planned out blueprint would have been able to save a structure built by a few 12-year-olds hopped up on Mountain Dew and unfounded confidence, but it sure wouldn’t have hurt.
With every new analytics project I take on, I have seen enough blanket forts to know the importance of a well thought out analytics tracking strategy. Just as you should never build a house (or fort) without a blueprint, no analytics solution should be constructed without careful planning first.
Just as you should never build a house (or fort) without a blueprint, no analytics solution should be constructed without careful planning first. Click & Tweet!
What is an Analytics Strategy
When someone says, “analytics strategy,” it could mean many things. Some people simply call it an SDR (Solution Design Reference). Sometimes when people say, “analytics strategy,” they are referring to how these analytics tools fit into the business as a whole. For the purposes of this blog post, when I say analytics strategy I am referring to a blueprint or architecture encompassing your goals, Key Performance Indicators (KPIs), and desired outcomes integrated with your analytics solution. We also refer to it as an analytics tracking strategy.
Just as a blueprint shows engineers exactly what to build and how to build it, an analytics tracking strategy will help developers know what needs to be implemented and guide analysts to find answers to key business questions.
We’ve all heard the expression “crap in, crap out.” More than anything, a well designed analytics tracking strategy will help you avoid that scenario.
Why Do You Need an Analytics Strategy?
I recently read an article written around 55 years ago and it really struck me that this isn’t a new concept I’m talking about here. There was a well known quote in it that illustrated my point long before digital analytics even existed.
“Having lost sight of our objective, we redoubled our efforts.” Click & Tweet!
This speaks to the fact that without a clear objective, more effort and a less desirable outcome is the inevitable result.
I find a lot of organizations are stuck in this scenario. When a digital analytics implementation is setup without taking the proper time to consider business goals, organizations find themselves vulnerable to some particularly frustrating hazards.
Challenges Resulting from an Incomplete Analytics Strategy
Challenge #1: Unnecessary Fluff

One such situation is they find they have an analytics implementation with a lot of unnecessary fluff being tracked. This can be characterized by an organization that spends too much time and effort on brittle or complicated tracking features that will provide a minimal-at-best return on investment (ROI). When end users don’t have clear KPI’s (key performance indicators) that they can focus on in the reporting, they tend to ask questions of the data that are largely unproductive.
Challenge #2: Unusable Data

Another pitfall companies fall into without a defined analytics strategy is they have KPI’s tracked in a way that’s contrary to best practices. This causes the data to not be readily available, limiting deeper analysis. Often this means extra time is needed to create one-off reports that are not scalable, difficult to reproduce, and nearly impossible to break down for deeper questioning.
This starts out as a waste of time, money, and resources, and when left unaddressed, can quickly spiral out of control causing analysts to spend their time recreating complicated reports instead of finding valuable insights.
Challenge #3: Brittle Data That Breeds Distrust

I’ve seen this in many different shades from companies of all shapes and sizes. There was a time when I was working with a company that was growing very quickly. So quickly that they had never had any time to put together a comprehensive analytics tracking strategy around what was important to track and what wasn’t.
As they continued to expand and grow, they didn’t take the time to map out clear goals and requirements for their development team which meant they had no data layer. This gave rise to a lot of DOM scraping and custom code in order to track simple things. This, of course, meant the data was extremely brittle and would break seemingly on a daily basis. Unavoidably, this led to distrust in the data.
Challenge #4: Focusing on What Could Be Tracked, Not What Should

Another outcome of not having a clearly defined analytics tracking strategy was there was no discussion about what really mattered as new pages, site sections, and sister sites were created. When they decided what to track it felt like they were simply throwing things against the wall to see what would stick. There was much more concentration on what could be tracked rather than what should be tracked. Rather than track key interactions that lead towards an eventual conversion on the site, they were more interested in things like:
- Which dot on the rotating banners is the user clicking on?
- How often are users clicking on the little button that brings them back to the top after you scroll to the bottom?
- How long was a user on page x before they click on link y?
Challenge #5: Tracking Without Focus on End Game

When you approach your digital analytics tracking without clear intentions, the questions you ask of your data will similarly be without intent. The types of questions that were asked regularly would be along the lines of:
- After users click on link A in the footer, what is the most common next link clicked?
- How often do users click on link B in the nested navigation system and then exit off the resulting page?
- For those users who click link C in the footer, click one thing and then exit, what is their most frequent next click pre-exit?
- What are the top links clicked on page abc?
Now, it’s not that these questions are bad in and of themselves. The issue is they lack a greater purpose or direction. It’s fine to want to know if a certain UI feature is being utilized, but when you’re asking these sort of questions, consider what you will do when you know the answer to those questions. What sort of action can you take from knowing that data? Will that action make you a more successful business?
Worst Thing: Consistently Inaccurate
The worst thing that can happen is your team becomes so complacent with the state of the data that they’d rather keep the bad data than fix it because to fix it would mean the data would be different than what they were used to. I remember overhearing a conversation where a client was presented with some suggestions on how to make the data more accurate. The response was something along the lines of “well, is the data at least consistently inaccurate? Let’s just leave it be then.”
Common Analytics Strategy Mistakes
![]()
It’s no shock that while having a solid analytics tracking strategy is vital to future success, people still find ways around putting in the effort. There are numerous shortcuts I see people take, but I’d like to specifically address two particularly common mistakes, the problems they cause, and the justifications that allow problems to go on unchecked.
Mistake #1: Trash Can Variable
This is something I’m sure a lot of people reading this have done before or have seen done. This is where rather than take the time to categorize which items on the site are most important and how they should be tracked, it is decided that we will just throw all links into the same eVar.
![]() Note: this scenario can apply to any analytics tool with custom variables but in this post I’ll be referring to an eVar in Adobe Analytics as the variable of choice.
Note: this scenario can apply to any analytics tool with custom variables but in this post I’ll be referring to an eVar in Adobe Analytics as the variable of choice.
Common Justification
The common justification is, if we have at least a good enough naming convention then we will easily be able to identify unique links and when they are clicked. I understand the thought process here — it’s a lot of work to put together a thorough analytics tracking strategy and usually teams are already under the gun to get the next iteration published before the deadline. Analytics has often taken the back seat and been at the mercy of other stakeholders. Since we don’t have the time or resources right now, we’ll put everything into an eVar (because that’s the most powerful variable) and spend that time on the reporting end to figure out what’s important later on.
Problems with this digital analytics tracking approach:
- It encourages people to focus on clicks and hits instead of more important KPI’s. When people use a trash can eVar they spend hours pulling up filtered reports to show how often certain links are clicked and equate an increase in these clicks to successful growth. It also leads to people asking questions like, “which navigation link on this page is driving more sales.” Notice how this question focuses on the click or hit instead of the customer. These are simple questions that bring simple answers that won’t move the needle.
- In nearly every situation it moves beyond the original intended use. Even though it starts out with something as innocuous as, “let’s track all of our navigation with an eVar. We’ll add the prefix of ‘nav’ and then the value clicked.” Then someone decides to use this same eVar for clicks in the footer, then clicks on the side nav, then clicks within the body of the page, and before you know it this same eVar is being used for all sort of call to action buttons throughout the site as well. Let’s say you want to see how many newsletter signups come from a certain CTA button on the site. That should be easy right? Just pull up the eVar and filter by the by the right CTA and add the newsletter signup event. Here’s where the problem shows up. What if a user clicks on a CTA and then clicks on a navigational link before they sign up for the newsletter? You’ve just overwritten your CTA click with a navigational click (something completely unrelated). You’ve basically stripped this eVar of everything that made it valuable as an eVar.
This trash can eVar tracking approach is like buying someone an iPad and then watching them use it as a cutting board. These digital analytics tools have so much potential for ROI, and yet people have opted to use them in the most primitive manner — as a glorified hit counter.
Mistake #2: Track Everything
![]()
While the trash can variable is more of a tactic that people use, “track everything” refers to mindset and a culture. Very often, but not always, the trash can variable is just a symptom of a this larger issue.
Common Justifications
The idea here is rather than pick and choose what is most important to our business and what is going to bring us most valuable insights, we will just track every possible thing we can think of and figure out what is important later. I understand and sympathize with the logic behind this mentality. For starters, there are SO MANY cool things we could figure out about our website. The possibilities are endless. It’s often tempting to track things because you simply “want to know” the answer. Sometimes I feel like a kid in a candy shop with a new implementation. Eager to try out every possibility.
There’s also the fear that if you don’t track it now, 4 months down the line you’ll have a question that you won’t be able to answer because the data isn’t there. I get that. These justifications are very good ones and they might seem hard to deny. Trust me, they aren’t.
First off, in nearly every situation where I’ve seen a client try to track everything, there simply aren’t enough resources to support that level of implementation. With an implementation of 200+ custom dimensions, it is almost guaranteed that at least 100 of those will sit there gathering dust while you work to make sure the first 100 are still working. The more variables you have implemented, the more items you need to QA and fix as the site evolves. For the majority of analytics teams I’ve worked with, the upkeep alone would take up all of their time.
The other problem I have with this mentality is it forces analytics to become an afterthought.
Take the two scenarios, for example:
- You are creating a new landing page for an event your company will be throwing next month. You are almost ready to publish and you remember that you are supposed to add analytics to this page. After pulling in the analytics team you have been instructed to add some tags to the site to track all of the links that can be clicked on.
- As you are creating your new landing page, you remember that there has been an initiative from the analytics team to funnel users through a certain path to enter their names into a lead generation form. You also know that as a secondary KPI, you should also be focused on email sign ups. This changes the way you design the landing page so that you can focus on these essential KPI’s. You also know that it is important to relate these KPI’s to the campaign that brought them to the landing page. You tag the links sent to the landing page appropriately.
Scenario 2 might sound like a pie-in-the-sky utopian view of life, but it doesn’t have to be. In scenario 2 teams are prioritizing analytics and insights and making conscious decisions based on past insights they have received from the analytics team. It was easy for the analytics team to pass the insights along because the they knows what is important and what they are looking for when they run their analysis.
In scenario 2, data lives in the limelight. In scenario 1, analytics is forced to be a postscript.
I am a firm believer that if you try to track everything, you will end up being overwhelmed with a lot of meaningless data and the actionable data will be hidden from your view. I would much rather see a company have 10 meaningful and impactful reports based on important KPI’s than have 100 variables and reports that provide little to no value.
Where Do You Start? With The Why
There is a fantastic TED talk done by Simon Sinek where he talks about the concept of starting with the why. If you haven’t seen it, I highly recommend it (or read the book!). In his TED talk he explains that what sets influential companies apart from the rest is they start with the why instead of the what.
![]() “Every single person, every single organization on the planet knows what they do. Some know how they do it, whether you call it your differentiated value proposition or your proprietary process or your USP. But very, very few people or organizations know why they do what they do. And by ‘Why’ I don’t mean ‘to make a profit.’ That’s a result. By ‘why’ I mean: What’s your purpose? Why do you get out of bed in the morning? And why should anyone care? As a result, the way we think and act, the way we communicate is from the outside in. It’s obvious. We go from the clearest thing to the fuzziest thing. But the inspired leaders and the inspired organizations — regardless of their size, regardless of their industry — all think, act, and communicated from the inside out.” — Simon Sinek
“Every single person, every single organization on the planet knows what they do. Some know how they do it, whether you call it your differentiated value proposition or your proprietary process or your USP. But very, very few people or organizations know why they do what they do. And by ‘Why’ I don’t mean ‘to make a profit.’ That’s a result. By ‘why’ I mean: What’s your purpose? Why do you get out of bed in the morning? And why should anyone care? As a result, the way we think and act, the way we communicate is from the outside in. It’s obvious. We go from the clearest thing to the fuzziest thing. But the inspired leaders and the inspired organizations — regardless of their size, regardless of their industry — all think, act, and communicated from the inside out.” — Simon Sinek
Applying this Concept to Your Analytics Tracking Strategy

I’d like to take this concept and refocus it on your analytics tracking strategy. Too often people start their strategy with the “What.” They ask: “what on this page can we track?” They do that because it’s the easy question. It requires nothing more than to literally point at things and confirm that you can in fact track those things.
- We can track clicks on this link
- We can track the views of this video and how long they spend watching content
- We can track how often users add items to their cart and purchase
- We can track how often users click on our call to action buttons and banners across the site.
They then move a bit further into the circle. Ok we know that we can track those things. How will we track them?
- Well, with these CTA’s it would make sense for them to be tracked as an eVar that expires on visit.
- We’ll track those banner ads with the enhanced ecommerce promotions functionality.
- We can track the video views with heartbeat analytics in Adobe.
- We can track the user as they log in with an alias call in Mixpanel so we can stitch together the user behavior.
And so on. This requires more expertise with the tool, but it is a tool centered approach rather than a business centered approach.
Unfortunately this is where too many stop. They don’t even get to the why.
Instead, I propose we start working from the inside out with our analytics tracking strategy.
Steps for Developing an Analytics Tracking Strategy

Step #1: Start with Business Goals
Start with the essential business goals. If you don’t know what those are, start with easy questions:
- Why does business exist?
- What are we trying to accomplish?
- What is your business’ mission statement?
- What pays the bills?
Basic examples of Business Goals
Retail: We want to provide the highest quality athletic wear. We want to gain new customers and generate brand loyalty to existing customers.
Business services: We want to inform the public about our service offerings and get them to contact us through lead generation forms or by other means.
Non-profit: We are working to reduce the number of school dropouts in our community.
Content creation site: We strive to provide our users with the highest quality and most up to date local news stories in an effort to keep the public informed and involved.
Step #2: Translate Business Goals into Requirements
Work on translating these purposes into tangible reporting requirements for your analytics. To start, ask yourself:
- How does our website/app/internet connected device (kiosk, alexa skill etc) help us achieve that overall purpose?
Basic Examples of Reporting Requirements
Retail: Our website helps customers find and buy our products as well as participate in programs to increase their loyalty. We need to be able to track these purchases and loyalty registrations.
Business services: On our website we post blog posts, white papers, case studies intended to drive potential customers to contact us through our lead generation forms. We need to track the completion of these forms as well as sign ups for our mailing list.
Non-profit: On our website we post videos and stories of how we have taken action in our community to drive positive change. We send out newsletters with opportunities for people to join the cause and volunteer. We do this to inspire visitors to donate to the cause either monetarily with their time. These donations and volunteer hours are vital to our organization and need to be tracked.
Content creation site: Our website is one of the main vehicles we use to provide users with the content we produce. We generate revenue by getting our content in front of as many eyes as possible as well as getting them to sign up for subscriptions or pay to view more articles. We need to track and increase our readership as well as track our subscriptions and purchases of paid content.
Step #3: Translate Reporting Requirements into KPIs
Finally, translate these reporting requirements into tool centric KPIs.
In other words, what metrics and dimensions will be used to gather the data necessary to determine the success or failure of the above requirements and goals?
Basic Examples of Tool Centric KPIs
Retail: (Google Analytics Example) With Google Analytics Enhanced Ecommerce we can track the products that are purchased. Track the sign up for loyalty programs with a custom event and a goal completion.
Business services: (Adobe Analytics Example) We can track the form submissions with a custom success event.
Non-profit: (Adobe Analytics Example) We can track the volunteer sign ups with a custom success event as well as track the donations the same as we would regular transactions on a retail site with product variables and transaction ID’s.
Content creation site: (Mixpanel Example) We will track the purchase of using events as well as track lifetime value and with people properties.
Now, What Else to Track?
From here you can begin to expand. What sort of data can you track to augment the key data points you just decided to capture?
Retail: Track the product categories, product type, sale status, etc with product level custom dimensions. Track the loyalty customer ID with a user scoped custom dimension as well as their loyalty status and past purchase history. In order to better segment these users based on their behavior.
Business services: Track the form completion rate by firing an event when the lead generation form is started and build a calculated metric in Analysis Workspace. Track the service type that the user is inquiring about in an Custom Conversion Variable (eVar). Track the traffic source that brought them to the site using marketing channels. Track the white paper and case study downloads using download events.
Non-profit: Track which events users are volunteering for by using a Custom Conversion Variable (eVar) and custom success event. Track the newsletter sign ups with a custom success event and track the links in those newsletters with the campaign tracking variable.
Content creation site: Track types of content the users are consuming through event properties. Track the authors of that content and the topics contained within to see what sort of stories provide the most engagement and retention. Track their subscription status to identify who is consuming free content vs paid content.
As you begin to expand your analytics tracking strategy, always remember that not all metrics and dimensions exist in a vacuum. They often need to be broken down by or combined with one another to answer business questions. I know I’m not the only one who has set up tracking for an important KPI only to realize a few weeks later that based on the questions that are now being asked of that KPI, it should have been tracked as a merchandising eVar, instead of a standard eVar, or a prop instead of an eVar, or a visit scoped custom dimension instead of a hit scoped one.
When you add tracking to a feature of your website or app, ask how will this metric or dimension look in the reports? Will it allow for me to answer the core business requirements? Will it allow for follow up questions and deeper analysis? These tools can get very complicated very quickly. Make sure you can confidently say you know the answers to the above questions before your tracking is set in stone.
Do More of What Works and Less of What Doesn’t
Retail: We have seen that products that have product videos on the detail page not only convert better, but the users who watch these videos have a higher likelihood of making a repeat purchase. This moves them up the customer loyalty status tier. Let’s begin adding product videos to more product detail pages in an attempt to increase conversion rate and generate more loyalty.
Business services: Looking at our marketing channels report matched up with our service type eVar, it has become clear that the view rate and conversion rate for the contact us form is much higher when our email links point the user to a case study page vs pointing them to a solution page. In our next email campaign we will experiment sending users to case study pages in order to increase the number of leads we receive.
Non-profit: We have determined that users are more likely to donate the same day they sign up for an event. When we send a confirmation email for their event sign up, we should also add quick link that brings them to the donation page. We will test this new template out to see if it increases the frequency of donations.
Content creation site: Users that read 3 or more articles a week are most likely to renew their subscription. Using this threshold we can identify users who are most likely to churn and send them different offerings in an effort to increase retention rate.
Avoid “Just Track Everything” Trap and Everything Falls into Place
When you focus on starting from the inside out — starting with the why…the core purpose of your business, everything else falls into place. It no longer becomes a guessing game of what is important to track and what isn’t. You no longer run the risk of falling into the “just track everything” trap and throwing every link into a trash can Custom Conversion Variable (eVar). Everything you tag is tagged with a purpose and can be directly related back to your overall business goal.
When you focus on starting from the inside out — starting with the why…the core purpose of your business, everything else falls into place. Click & Tweet!
Creating the Analytics Strategy Document
Document, document, document!
With all of this information it is a lot to keep track of and communicate to other individuals. I cannot stress enough that the analytics strategy needs to be documented, and it needs to be in a living document that is continuously updated.
Websites and apps are changing constantly — as they should. As your Analytics Maturity increases, your strategy will also EVOLVE. What you build for your analytics strategy today will most likely not stand the test of time.
Avoid Being Static
As your company grows, revisit your analytics strategy regularly and evaluate what data is yielding actionable insights, and what data is not being used. Eliminate variables that are figuratively gathering dust, and replace them. This ever changing nature of the analytics solution is why I prefer to shy away from static excel documents for everything. Instead, we recommend building out a Center of Excellence that can be edited and updated constantly.
This way there is one single source of truth. Not whatever is the most updated excel document living on Jonathan’s hard drive.
Analytics Strategy Documentation Example
Here are some screenshots showing examples of analytics strategy documentation created using the online team collaboration software, Confluence:

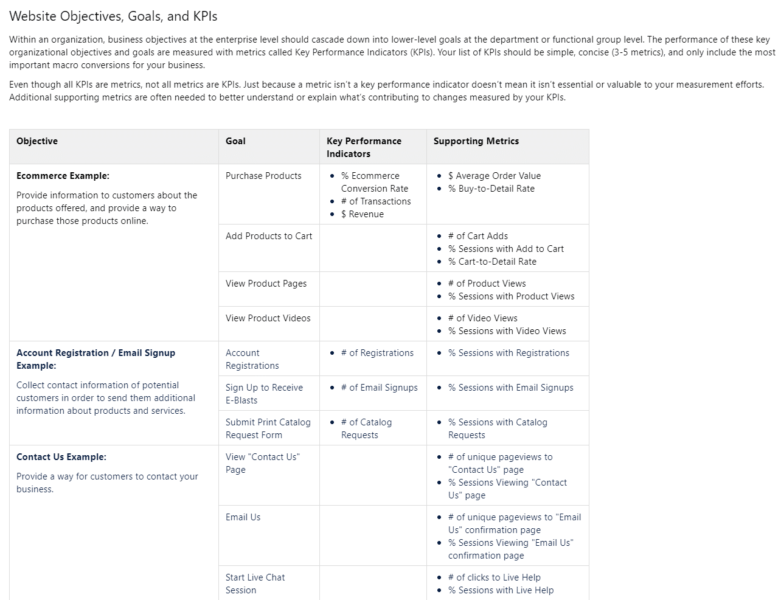
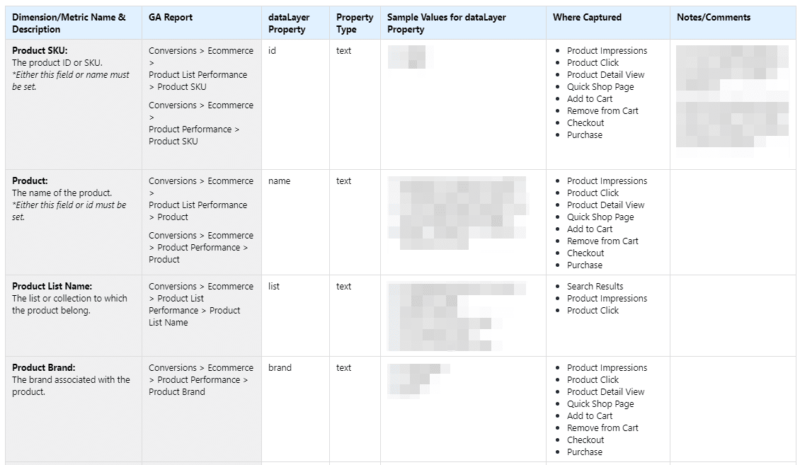
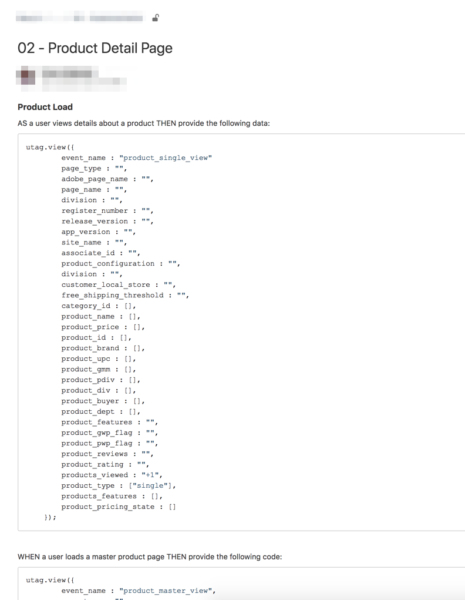
Though we haven’t covered the implementation aspect of this documentation in this post, with everything organized in the strategy step, it becomes very easy for the developers to fill in the code blocks after we write up user stories like this example:
Transform Your Business Goals Into a Powerful Analytics Strategy — Top 5 Takeaways
The effects of an organized and focused analytics tracking strategy can be felt outside of just the analytics team. When your analytics strategy is created as an afterthought, it often becomes hard to understand how your analytics tool is providing any real value (return on analytics investment). You will quickly realize that you can’t truly be data driven if you don’t know where you’re trying to go.
Thank you for making it through my thesis ( 🙂 ), I realize this is a lot to absorb in one sitting, so here are some cliff notes. In order to transform your business goals into a powerful analytics tracking strategy, remember the following:
- Your analytics tracking strategy is meant to not only guide the implementation, but future analysis as well. Without it, your implementation will lack direction.
- Be more specific and ask questions that yield actionable answers. Vague questions will always lead to vague answers. Vague answers will inevitably leave you unsure of where to go next.
- Identify your core business goals that will determine success or failure. When devising an analytics strategy, don’t start by asking what you can or should track, start by asking why your website exists at all.
- Transform these business goals into tool specific KPI’s that when analyzed, provide clear action items. Take action and iterate where necessary.
- EVOLVE your analytics strategy as your business grows. Strategies aren’t meant to be static. Regularly review your analytics and eliminate variables not being used. Keep everything in a living document.
By constructing your analytics tracking strategy around your core business purpose (i.e. your “why”), each piece of data collected becomes a building block that, when acted upon, brings you closer to your overarching goal.
Related Insights

Digital Analytics


If you have questions or you’re ready to discuss how Blast can help you EVOLVE your organization, talk to an Analytics Consultant today.
Call 1 (888) 252-7866 or contact us below.


