Analytics Blog

Persuasive Storytelling with Data Visualization
It was a dark and stormy night…
When Tableau came out with Story functionality, I thought to myself, “Why would I need this? My visualizations speak for themselves. I let the data do the talking.” I patted myself on the back, puffed up my chest, and went on my way. But storytelling and data visualizations don’t have to be one or the other. In fact they support one another, strengthening insights and driving the action the data is proclaiming.
 Why did I change my mind from “Data Rules! Words drool!”? I went to Domopalooza in March and attended a session led by Brent Dykes titled, “Once Upon An Insight: How to tell a better story with data.” And like Rene Zellweger’s character in the movie “Jerry Maguire,” he had me at hello. Why? Because he painted a very compelling story which showed how you can use Data to build a persuasive story which ensures the audience grasps the insights and takes action.
Why Storytelling is Effective
Studies show that stories are more effective than statistics in two ways:
- Data isn’t as memorable as stories. 5% remember the statistics, whereas 63% remember the story.
- Stories are more persuasive than statistics. Stories persuade twice as much compared to using just statistics.
Done correctly, stories engage the audience, causing us to use more of our brain. When you focus on data, your left brain (the logical side) is engaged, but a story will engage both the left brain and the right brain (intuitive, thoughtful). In addition, stories build a connection to the audience, increasing attention and empathy. And ultimately, stories open up the audience to change, which is more often than not the goal of your presentation.
“Stories build a connection to the audience, increasing attention and empathy. And ultimately, stories open up the audience to change…” Click & Tweet!
3 Elements to Data Visualization Storytelling
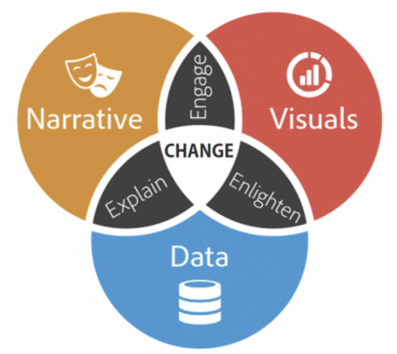
Persuasive data visualization storytelling uses three elements:
- Data
- Narratives
- Visuals
Data and Narratives explain. Providing context for your data, where it comes from, why its relevant, what you did with it, helps explain to your audience what it is and why it’s important.
Data and Visuals enlighten. Data by itself, just numbers, often leaves people scratching their heads. But when you create a good visualization that clearly shows the data and what it means, that is when you get an “Aha!” moment from your audience. They have been enlightened!
Narratives and Visuals engage. Clear and concise communication along with a good visualization, engages your audience, it draws them in and grabs their attention.
The combination of all of these brings change, which as mentioned before is often the goal of your presentation. Brent’s presentation at Domopalooza 2018 provided a simple Venn diagram that clearly shows how the three components interact:
Turning Your Findings into a Story
You’ve spent your time doing analysis, making discoveries, now it’s time to put your findings into a story. And like any good story, there are four stages (not beginning, middle, and end):
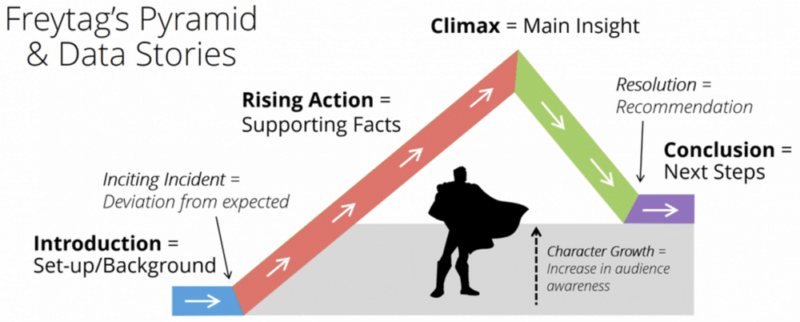
Step 1: Set Up
Like any good story, you need to set the hook so that the audience is interested in continuing. Otherwise, they’ll put the book down. What is deviating from expectations? What opportunity is being overlooked? You want to ensure your audience understands there is an issue and it needs to be addressed, an opportunity to seize. In addition, be sure to provide some background and context, explaining the current situation.
Example:
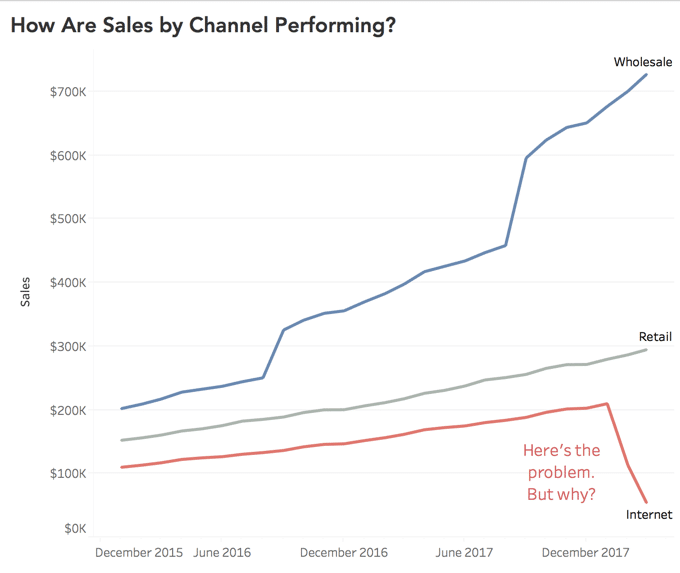
“For the first time in our company’s history, Sales compared to the prior month decreased. This happened in both February and March of 2018. What happened?”

Step 2: Rising Insights
Show the steps you took in your investigation, the analysis performed, findings, and the supporting facts. This builds towards and supports the key finding.
Example (continued):
Insight 1: “To find out what happened to sales, we dug deeper, looking at Sales by Channel and found that Internet Sales showed a significant drop in both February and March 2018.”
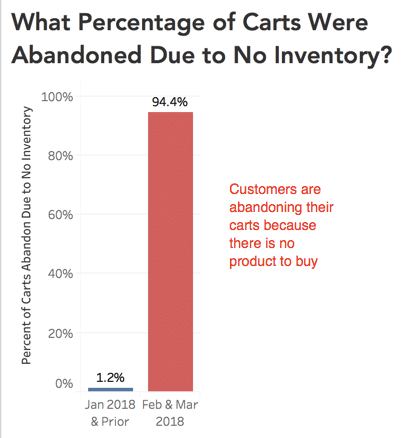
Insight 2: “But why did Internet Sales decrease? Looking at our web data, we found that customers were still coming to our web site, in fact sessions had increased at the same steady rate as the past. However, we found Customer Shopping Carts were being abandoned at a very high rate starting in February 2018.”

Step 3: Aha Moment
Hit them with the key finding, the main insight. Your audience at this point should be saying, “Duh, of course! It’s obvious now!” They need to be on your side, wanting to act on the insight.
Example (continued):
“Why would customers, who were in the process of making a purchase, abandoned their carts? This was not occurring prior to February 2018. That’s when we discovered that approximately 94% of the shopping carts were being abandoned due to no inventory being on hand for the products in the cart! Customers can’t buy if we don’t have the product in stock. That is the cause of our decrease in sales.”
Step 4: The Solution
Clearly define the action(s) that needs to be taken. What are the next steps?
Example (continued):
“We haven’t seen a decrease in sales, we’ve seen a decrease in our ability to stock the products our customers want to buy.”
As such, we recommend the following…
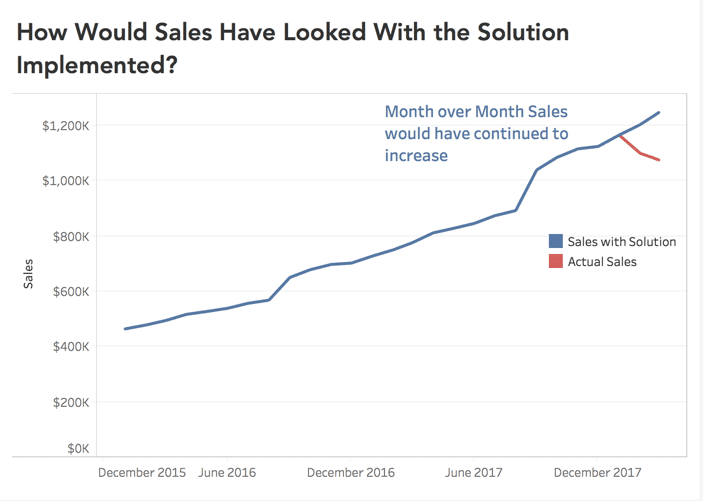
If we did the above, our sales through March 2018 would have continued our stellar month over month increase, which would look like the following:
![]() Note: To see this data visualization storytelling example using Tableau Story, you can visit the Tableau Public site.
Note: To see this data visualization storytelling example using Tableau Story, you can visit the Tableau Public site.
As you work at creating your story, determining what to put in each of the stages, consider the following:
- Align data to your message. You probably have a lot of data and visualizations that support the entire story, but be selective. Choose the data that best illustrates and support the point you are trying to make.
- Identify the right visualization. Refine and rework it so that it clearly communicates your intention. The audience should be able to look at your visualization and see that it clearly reinforces the point you are making.
- Remove unnecessary noise. If your visualization includes a dimension (attribute) that has many possible values, eliminate the noise by grouping lower values into an “other” category. Avoid using more than five values when possible.
- Focus on what is important. Use color to highlight what matters, make the issue or opportunity stand out.
- Main Point: Make sure you have a main point! If your audience is supposed to intuit the main point, they may come up with something you did not intend, and as such may take no action or take action that isn’t relevant or needed.
Consider your Audience
Lastly, make sure you adjust the storytelling to your audience. What and how you present your story to one audience could be different than what and how you present to another audience. Are you presenting to the CEO, you may want to limit the amount of details, allowing you to get to the Aha Moment and Solution quicker. But make  sure you don’t dilute or dismiss the Set Up, you need to have a point and the Set Up helps establish the issue or opportunity.
To match the narrative to the audience, assess the following:
- What are their goals and priorities?
- What are their beliefs? Are they likely to agree with your finding and support the solution, or will they need additional information and insights to persuade them to change?
- What are their expectations? Are they expecting good news, bad news, another boring meeting that doesn’t help push the company forward?
- What is their familiarity with the topic? You may need to provide more background, context, and information to help them better understand the issue or opportunity.
- Are they data savvy? If so, you may be able to rely on visualizations more, and less on narrative, since they already have a pension for wanting to see what the data is showing.
- What is their seniority level? As mentioned already, what and how you present to the CEO may be different than what you present to a mid-level manager.
Keep in mind, you don’t always need to tell a story. Storytelling is needed when the insights are hard or challenging to understand, when the business impact is high. If the data is showing something that is unpleasant, disruptive, unexpected, complex, costly, or counter intuitive, then you have a good candidate for a story. However, if the data is showing something that is agreeable, meaning the audience is already predisposed to agree with the finding, then it’s a non-story.
“Storytelling is needed when the insights are hard or challenging to understand, when the business impact is high.” Click & Tweet!
Make it a Story with Visualizations
So the next time you are working with your data and uncover important insights, consider communicating your findings, proposed solution and next steps with a story. By adding Narrative and Visuals, you’ll have a better chance of engaging your audience, drawing them into agreement, and driving them to take the appropriate action. Data will still be the driver, but you’ve improved your chances of achieving the desired actions.
Caveat Emptor. Now that you are bought in and hopefully excited to start telling stories, keep in mind that there are some common pitfalls to avoid to make sure you don’t unintentionally mislead when telling your stories. Read up on these pitfalls and please share any good examples of Storytelling with Data Visualizations that you create or find. We’d love to see them (provide links if possible).
Related Insights

Digital Analytics


If you have questions or you’re ready to discuss how Blast can help you EVOLVE your organization, talk to an Analytics Consultant today.
Call 1 (888) 252-7866 or contact us below.


