Analytics Blog

Implementing ETL Process Steps (to Import Google Analytics into Data Warehouse)
![]() Recently, I published a post covering the first steps in defining an ETL process. If you missed it, you may want to start there to learn why data warehouses exist, how to create an ETL infrastructure, and how to determine your data requirements. I also began teasing part two by providing a few details on an actual ETL example using Google Analytics data. In this post, I’ll continue to flesh out that example and show you how to create the data model, the database, develop the ETL, and test/implement.
Recently, I published a post covering the first steps in defining an ETL process. If you missed it, you may want to start there to learn why data warehouses exist, how to create an ETL infrastructure, and how to determine your data requirements. I also began teasing part two by providing a few details on an actual ETL example using Google Analytics data. In this post, I’ll continue to flesh out that example and show you how to create the data model, the database, develop the ETL, and test/implement.
Creating the Data Model
There are three types of tables which are central to most data warehouses and will be part of most data models:
- Staging tables
- User Maintained tables
- Reporting tables
Staging Tables
A good practice with ETL is to bring the source data into your data warehouse without any transformations.
The data is put into staging tables and then as transformations take place the data is moved to reporting tables. IuIn addition, I like to keep a copy of the original data in a historical table so that if I ever need the original data to re-process, it is readily available. (Disk space is fairly inexpensive, so the convenience and flexibility provided by having the original “raw” data is worth the cost.)
Since we will be utilizing the Google Analytics API, we can only pull 7 dimensions and 10 metrics. Therefore, we will have four staging tables for our “raw” data, and four staging tables which will hold the historical data (the “raw” historical data).
(click picture to enlarge)
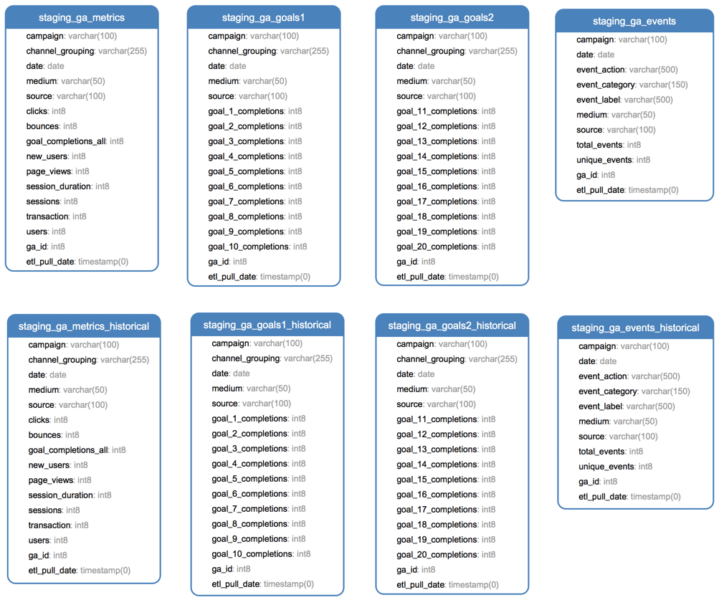
Notice the following in each staging table:
- There is no primary key or constraints. Source data may not be reliable, so adding a primary key or constraints could prevent data from being loaded to the staging tables. The ETL process of transforming and moving data to the reporting tables should have steps in place to ensure constraints and primary keys are enforced.
- The last two columns in each table are ga_id and etl_pull_date.
- The ga_id will be added by the ETL program, and it identifies the view/client the Google Analytics data is associated with (since we are pulling more than one view/client).
- The etl_pull_date is a date/time stamp which will also be added by the ETL program. It shows the date and time that the data was pulled from the source, which can be useful when troubleshooting issues. As a best practice, I add the etl_pull_date to all my data pulls and tables.
User Maintained Tables
Due to the transformation requirements, there are several user maintained tables (tables where additional data is provided by users, as the data isn’t available elsewhere). These user maintained tables will provide enhancements/additions to the data.
(click picture to enlarge)
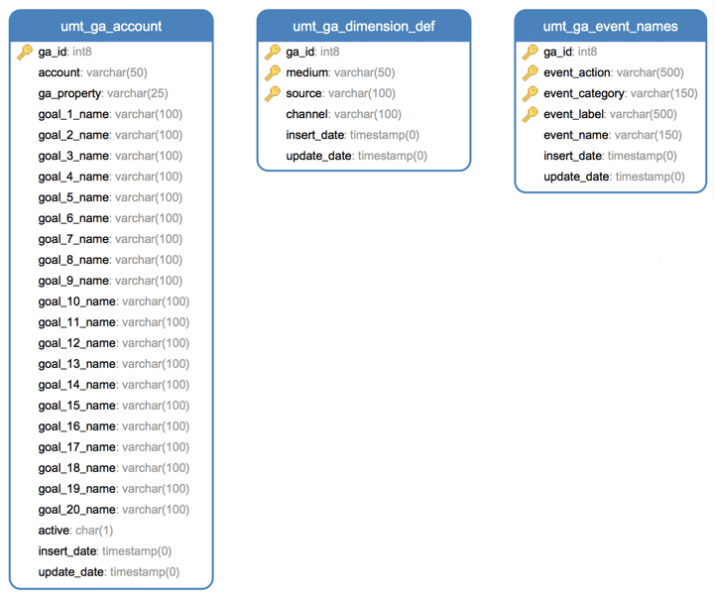
The User Maintained Tables serve the following purposes in our ETL example:
- umt_ga_account: Provides the list of GA-ID’s data (view/client) whose data will be extracted by the ETL. Important fields to note:
- ga_id: Google Analytics unique id that represents a view that has been created for data. This is the primary key, and in our example it will be used by the ETL to identify which ga_ids need to be pulled as part of the ETL.
- account: This is the user friendly name for the view/client, which will allow users to easily select which view/client they wish to report against).
- ga_property: Google Analytics field that identifies the overall owner of the data. Many view (ga_ids) can exist under a ga_property. Help further identify the data.
- goal_1_name through goal_20_name: The user friendly name for each goal (e.g. Product Added to Shopping Cart). Will provide user with a clear understanding of the Goal, instead of a generic unknown of Goal 1.
- active: Indicates whether the ga_id is active and the data should be pulled via ETL. Possible values are Y or N. ETL will pull data if the value is Y.
- insert_date: The date the record was added to the table.
- update_date: The date the record was last updated.
- umt_ga_dimension_def: Provides the logic for deriving the Channel, based on the ga_id (the specific view/client), medium, and source.
- ga_id: Google Analytics unique id that represents the view/client.
- medium: The medium as defined by Google Analytics.
- source: The source as defined by Google Analytics.
- channel: The user defined Channel that should be displayed based on the ga_id, medium, and source.
- insert_date: The date the record was added to the table.
- update_date: The date the record was last updated.
- umt_ga_event_names: Provides the user friendly name for an Event based on the ga_id (the specific view/client), event_action, event_category, and event_label.
- ga_id: Google Analyticsunique id that represents the view/client.
- event_action: The event action as defined by Google Analytics.
- event_category: The event category as defined by Google Analytics.
- event_label: The event label as defined by Google Analytics.
- event_name: The user defined Event Name that should be displayed based on the ga_id, event_action, event_category, and event_label.
- insert_date: The date the record was added to the table.
- update_date: The date the record was last updated.
The User Maintained tables can be maintained through several options, depending on the number of records that have to be maintained and the frequency of additions and changes:
- Via SQL: Users provide additions and modifications to their IT Team to insert and update records
- Excel Spreadsheets: Owner of the data maintains an excel spreadsheet of the data. As needed, the spreadsheet can be passed to the IT Team to have the data in the table deleted and replaced with the contents in the excel spreadsheet.
- Web Based CRUD (Create Read Update and Delete) Tool: Develop a web based application which allows specific users the ability to use the tool in order to insert, update, and perhaps delete records.
Each of the above requires the implementation of business processes to ensure data integrity is maintained. Click & Tweet!
Each of the above requires the implementation of business processes to ensure data integrity is maintained. For example, you don’t want to delete records that relate to other tables or that are used as part of the ETL logic to derive fields.
Reporting Tables
The reporting tables will be the tables users will utilize for their analysis and reporting. In most cases users won’t need access to the staging tables as the reporting tables, and in some cases the User Maintained tables have the final cleaned and transformed data needed for reporting.
(click picture to enlarge)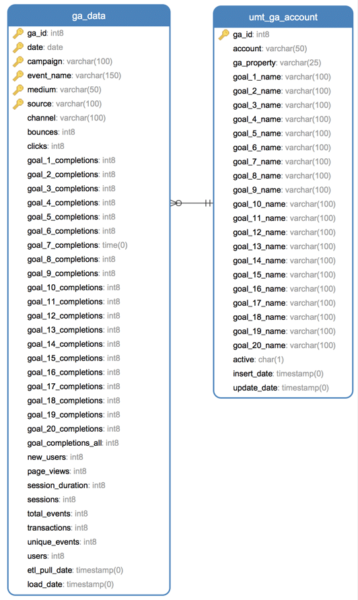
The ga_data table shows that the four separate Google Analytics data pulls (data found in the four staging tables): (1) staging_ga_metrics; (2) staging_ga_goals1; (3) staging_ga_goals2; (4) staging_ga_events) have been Unioned and aggregated to the appropriate primary key level, and adds the new Channel and Event Name fields. The ga_data table can be joined to the umt_ga_account table to get the Account name associated with the data as well as the user friendly names for the goals.
As a later step, you could create a dynamic view which will have the actual user friendly names for all the goals as column names. The view would be dynamically created each day, to capture any changes to the user friendly goal names that might have occurred. However, I won’t go into the details for this solution.
The ga_data table not only has the etl_pull_date to show when the data was pulled from the source system but also a load_date. The load_date is the date the data was loaded to the table. This can help if you ever need to reprocess historical data. For example, suppose it is March and you determine that the logic for the Event Name and Channel should have been changed in February. You make the appropriate changes to the User Maintained tables to revise the logic and then you can reprocess the data for February forward by using the historical data in the staging historical tables. The load date in ga_data would show that all the February records were re-loaded or re-processed in March (they would have a March load_date). Having the load_date can be useful for troubleshooting and understanding when the data was processed and therefore the “rules” it used for transforming data.
Create Database, Schemas, Tables and Constraints
Database
As a best practice, your database environment should have the following databases:
- Development: All development work is done here. Changes can be made by developers as needed while they create solutions, work on revisions, investigate bugs, etc.
- QA: This as a quality assurance environment. As solutions are ready to be tested, they are done in this environment. Control over this environment is important, as you need to make sure it is clean and has appropriate data which users can perform testing to ensure solutions meet the requirements.
- Production: This is where the actual day to day ETL data loads occur and reporting and analysis is performed. This system needs tight regulations and thorough business processes to ensure data quality. New solutions (or bug fixes) are only added to the production environment after User Acceptance Testing (UAT), in the QA environment, has been completed and signed off.
Schemas
Schemas are like file folders within a database, they help you logically group your data. I suggest a staging schema, where the raw data is loaded, and a reporting schema where the reporting tables are located. Some people create a schema for each data source. So if you have ETL to pull data from Google Analytics and AdWords you might have a ga_staging, ga_reporting, aw_staging, and aw_reporting schemas.
It all depends on your business needs and how the data will be utilized.
Tables and Constraints
Using SQL, create the tables and constraints based on your data model. Many database modeling tools will take the model you created and provide you with the SQL to create the tables and constraints.
Remember the recommendation that your staging tables do not contain any constraints (not null fields, primary or foreign keys, etc.), as it might prevent data from loading. Instead, set up your ETL programs to implement and ensure constraints are enforced as data is transferred to reporting tables.
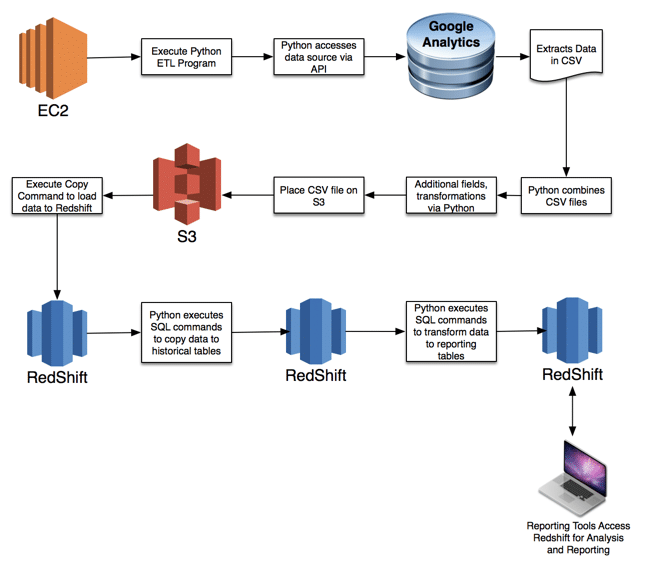
ETL
![]()
ETL has three steps: (1) Extract; (2) Transform; (3) Load.
Extract
You can connect to, and extract data from, sources via:![]()
- API (Application Programming Interface)
- Direct connection to a database (Oracle, AWS Redshift, SQL Server, etc.) and use SQL
- CSV, TXT, and Excel files that have been created and delivered to a FTP site or Server
In our example, we use the Google Analytics API, and with Python we create a program to utilize the API to access and extract the data we identified in the requirements, extracting the data into a CSV file. However, we add an extra twist. We have the umt_ga_account table which lists the various ga_ids that we need to extract data. Each ga_id requires a separate pull (as the data in Google Analytics is segregated by ga_id). So we perform the following steps with our Python program:
- Login to the data warehouse
- Query the umt_ga_account table to get a list of the active Google Analytics IDs which we need to pull data.
- (SELECT ga_id FROM umt_ga_accounts WHERE active = ‘Y’)
- For each Google Analytics ID returned from the query result in step #2, we do the following:
- Have Python utilize the OAuth access token granted by Google Analytics to access the data
- Pull the appropriate data for this Google Analytics ID
- Add a column to the resulting CSV file called ga_id and populate it with the Google Analytics ID currently being processed (every row of the data needs to have this ID)
- Add another column called etl_pull_date and populate it with the current date/time. (every row of the data needs to have this same date/time). Note: we have our Python program create this date/time stamp at the beginning of the program and we use this same date/time stamp for all the Google Analytics ID data pulls, so they are consistent.
- Once we have pulled data for all the active Google Analytics IDs, the CSV files for all the Google Analytics IDs are merged/unioned into one CSV file. For example, suppose there are 3 Google Analytics IDs in the umt_ga_account table. When the ETL for extracting the ga_metrics data is complete (all three Google Analytics IDs ga_metric data has been pulled), the three ga_metrics files will be unioned together into one ga_metrics file. The same thing is done for the ga_goals1 data, ga_goals2 data, and ga_goals3 data.
Load
![]()
Ok, so we don’t go in the order suggested by ETL (yes we did some light transformation by adding the ga_id and the etl_pull_date to the source data, but we’ll be doing more transformation later).
Instead, once our Python program has the Google Analytics data in a CSV file we use Python to login to the database and truncate the appropriate staging table where the data will be loaded (delete all records in the table) and then load the data in our CSV file into the staging table.
Since we’re using Redshift, we use Python to load the resulting CSV file to our AWS S3 instance (disk storage) and use a copy command to load it from S3 to Redshift. This is a Redshift best practice, as using S3 to load data to Redshift is significantly faster than using other tools.
For example, I’ve used Navicat to load 50,000 records from a CSV file to Redshift and it took about 20 minutes (depends on the number of columns you have and the size of the fields). The same data loaded from S3 to Redshift using the copy command took less than 10 seconds.
In addition, by loading the file(s) to S3, you now have a backup of the raw data you extracted.
Our source data is now in the appropriate staging table in our data warehouse.
Transform
![]()
We can have Python execute SQL statements. Most of our ETL can be done quickly and efficiently using SQL instead of Python. In our example we need to do the following (using staging_ga_metrics data asan example):
- Copy the data from the staging_ga_metrics into the staging_ga_metrics_historical staging table.
- Because we are pulling data from Google Analytics for the four previous days (Google Analytics can take up to four days to process a days data), we need to delete records from staging_ga_metrics_historical which have the same ga_id and date found in staging_ga_metrics.
DELETE
FROM staging.staging_ga_metrics_historical
WHERE CAST(ga_id AS VARCHAR) || CAST(date AS VARCHAR) IN
(SELECT DISTINCT CAST(sgm.ga_id AS VARCHAR) || CAST(sgm.date
AS VARCHAR)
FROM staging.staging_ga_metrics sgm);
-
- Once the data to be replaced has been deleted from staging_ga_metrics_historical, execute SQL to insert the data from the staging_ga_metrics into staging_ga_metrics_historical.
INSERT INTO staging.staging_ga_metrics_historical
(SELECT *
FROM staging.staging_ga_metrics sgm
WHERE CAST(sgm.ga_id AS VARCHAR) || CAST(sgm.date AS
VARCHAR) NOT IN
(SELECT DISTINCT CAST(sgmh.ga_id AS VARCHAR) ||
CAST(sgmh.date AS VARCHAR)
FROM staging.staging_ga_metrics_historical sgmh));
- Copy the data from the four ga staging tables into the ga_data staging table.
- Because ga_data contains data from all four staging tables, we create a view which unions the four staging tables into one view: (1) staging_ga_metrics; (2) staging_ga_goals1; (3) staging_ga_goals2; (4) staging_ga_events. The view aggregates the data to the primary key resulting in all the metrics being in the same row with each other for each unique record.
- The view also joins the data from umt_ga_dimension, using a left join, in order to add the Channel field which is to be derived per the requirements. The join is on the ga_id, medium, and source fields.
- The view also joins the staging_ga_events data with the umt_ga_event_names table, using a left join, in order to add the Event Name field which is to be derived per the requirements. The join is on the ga_id, event_action, event_category, and event_label fields. For the records from the other three tables (staging_ga_metrics; staging_ga_goals1; staging_ga_goals2), the value for Event Name is set to “All Non-Event Metrics”.
- Because we are pulling data from Google Analytics for the four previous days (Google Analytics can take up to four days to process a days data), we need to delete records from ga_data which have the same ga_id and date found in staging_ga_metrics.
DELETE
FROM db.ga_data
WHERE CAST(ga_id AS VARCHAR) || CAST(date AS VARCHAR) IN
(SELECT distinct CAST(sgamv.ga_id AS VARCHAR) ||
CAST(sgamv.date AS VARCHAR)
FROM staging.staging_ga_all_metrics_v sgamv);
-
- Once the data to be replaced has been deleted from ga_data, execute SQL to insert the data from the view (see #2.a above) into ga_data.
Test and Implement
Your ETL work is done, now it’s time to perform User Acceptance Testing (UAT), where the business owners validate that the data in the data warehouse matches what is in Google Analytics, and meets all the requirements. Once UAT is complete and signed off, you are ready to move your solution to production.
Some additional considerations:
- You’ll need to schedule your ETL program to run on daily basis (or however often your business requirements dictate) and implement in production. Just make sure that whatever granularity you pull your data (daily, weekly, monthly) you aren’t pulling sampled data. The goal is to get unsampled data which you can perform analysis and reporting against. This this should be done during development and should be part of the UAT.
- You will probably want to use your ETL program to pull historical data into the data warehouse, however far back the data in Google Analytics is available.
Once you have moved everything into production, your users will be able to perform deeper analysis, report with greater confidence, create visualization and dashboards, all without concerns of getting sampled data.
No More Constraints!
In the example, we use Google Analytics data, but you can create an ETL program for any data source. ETL will allow you to own your data allowing you to transform it, enhance it, clean it, whatever you need to do in order to:
- Meet your business needs
- Measure goals and objectives
- Answer business questions
Once in your own data warehouse, you can use the reporting tool of your choice to analyze, create visualizations and dashboards, no longer being constrained by the reporting tool offered by the data source. Click & Tweet!
And once in your own data warehouse, you can use the reporting tool of your choice (i.e. Domo, Tableau, Google Data Studio, Power BI, etc) to analyze, create visualizations and dashboards, no longer being constrained by the reporting tool offered by the data source.
Extra Credit – Gain More Dimensions
I mentioned that the Google Analytics API has constraints, which limit the number of Dimensions and Metrics you can pull via the API. ETL allows you to overcome the number of Metrics pulled, as shown by the Google Analytics example. You still are limited by Dimensions, because when you union your Google Analytics data, you need to keep the same level of granularity (i.e. same dimensions), or else you will get incorrect results.
As mentioned there are a couple of “tricks” you can implement to gain some more dimensions:
- If you are pulling both the Medium and Source from Google Analytics, instead of using two separate fields, use the SourceMedium field and have your ETL split the field into two separate fields after the data pull.
- If you need the date field and you are pulling data daily, you can drop the date field from the Google Analytics data pull, and populate it through your ETL program. In our example, we pull the last four days each day. The ETL would have to be broken down to pull each day separately and then have the ETL program derive what date is being pulled based on the date filter being passed to the Google Analytics API.uu
Related Insights

Digital Analytics


If you have questions or you’re ready to discuss how Blast can help you EVOLVE your organization, talk to an Analytics Consultant today.
Call 1 (888) 252-7866 or contact us below.


