Analytics Blog

Caution: Your RPV Statistical Significance Test Calculator is Misleading
Statistical significance calculations are critical, and using the right testing calculator is imperative to ensure your business is making the right decisions.
There is a real danger in trying to assume that revenue behaves like other standard metrics Click & Tweet!
To add context, in the marketing and business world, a lot of decisions are based on making adjustments to something like a website, and then determining if the adjustments made a significant impact on the business. This is what A/B testing refers to in this post.
When comparing two samples of data, typically one would run off to a standard statistical significance A/B testing calculator that takes in data and provides some significance numbers under the assumption that all the data is normal. The following is what a normal distribution, often called the “Bell Curve,” looks like.
Most data is normally distributed, so a typical two-sample t-test is sufficient, but what if the data is not normal? And what if operating under the assumption of normality leads to results that aren’t as reliable?
One user of the Blast Revenue Per Visitor test calculator pointed out this real danger:
“It is really interesting to see that so many people out there do not really know on what kind of basis they make their decisions. Especially if they just use some nice looking software or listen to some of those ‘it is so easy’ agencies. If you dig deeper it gets a lot more complex.” Click & Tweet!
Revenue per visitor (RPV), the primary KPI for most e-commerce businesses, is exactly like this, skewed and abnormal. As we will discuss in more detail, there is a real danger of encountering false positives when assuming that revenue behaves like other standard metrics.
The purpose of this blog post is to provide your team with a better understanding of the methodology used in the Blast Revenue Per Visitor (RPV) calculator. If you’re an online retailer, and your team is looking to make informed business decisions based on your test results, chances are you’re going to want to use a statistical significance test calculator that utilizes the most rigorous and reliable methodology.
Some may not consider it to be the “easiest” approach, but it will be far more trustworthy and dependable, as you will see below.
Revenue is Abnormal: Here’s Why It Matters
Revenue data is considered to be non-parametric data.
Or simply put, it doesn’t follow the “normal bell curve.” Most people who visit a website aren’t going to buy the product, which creates distributions like the one below. This wouldn’t be problematic, if not for the lack of reliable normal parameters such as mean and variance.
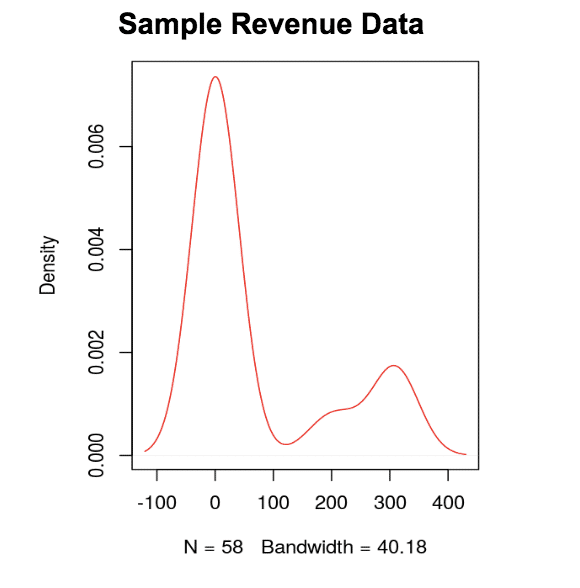
If you look at the skewed distributions below, you will see that the mean isn’t a reliable statistic because it’s not in the middle of the data!
You could use median, but again you lose a lot of data by simply using the middle value of the distribution. Therefore, using parameters like variance and mean/median to compare datasets when there is a skew can be risky, and this approach is what many statistical significance calculators take.

Not All Revenue Calculations are the Same
While reaching statistical significance is important, it’s just as important to understand the methodology a test calculator is using before relying on those results.
It’s one thing if the calculator is telling you that your results are insignificant, but it is far more risky if your statistical significance calculator is giving you a false positive and you proceed under the assumption that you have significant results. We strongly advise against your team making the assumption that all revenue calculators are the same, especially if the methodology behind the calculations are different.
We strongly advise against your team making the assumption that all revenue calculators are the same, especially if the methodology behind the calculations are different. Click & Tweet!
Now all technicalities aside, non-parametric data (like revenue) should be handled as what it is, instead of trying to fit a square peg into a round hole.
We know that teams are looking for validation of their test data and we created the RPV Calculator to provide the most accurate results for your team’s primary KPIs. To achieve this level of accuracy, the Revenue Per Visitor Calculator relies on the powerful Mann-Whitney U Test in R to handle the heavier calculations.
As a result, the RPV calculator can only accept CSV files. The “easy” test calculators do not use the Mann-Whitney U Test and instead may utilize a proxy approach where, because of the skewed data, they would have to sample from each population (or test sample) many times over. From this, the calculator would find the average sample mean for each population, and use this to perform the t-test. While this approach may be viable, it can not only yield less reliable results (because it relies on parameters rather than an entire dataset), but it unnecessarily introduces much more complexity with so much sampling.
So, what’s the main takeaway? Both tests are viable, but the Mann-Whitney U Test is meant for calculating revenue metrics. Click & Tweet!
So, what’s the main takeaway?
Both tests are viable, but the Mann-Whitney U Test is meant for calculating revenue metrics. and it doesn’t require the data to be manipulated to make it work, unlike the standard t-test approach (which requires the assumption of normality).
In addition, by utilizing the t-test for abnormal data, it is possible to reach significance sooner; this creates a higher risk of having a false positive. Using the Mann-Whitney U Test, however, you can be more confident that if your test yields significance, it actually is a significant result.
To further highlight why your team shouldn’t assume that all revenue calculators are the same. Below we’ve compared our calculator with another one (considered to be one of the “easier” statistical significance A/B testing calculators to use because it allows for a copy & paste method). With this comparison, you will be able to see how using the proper significance calculation (ex. Mann-Whitney U test) can directly affect the rigor of real test results.
Example of another revenue calculator (not using the Mann-Whitney U test):
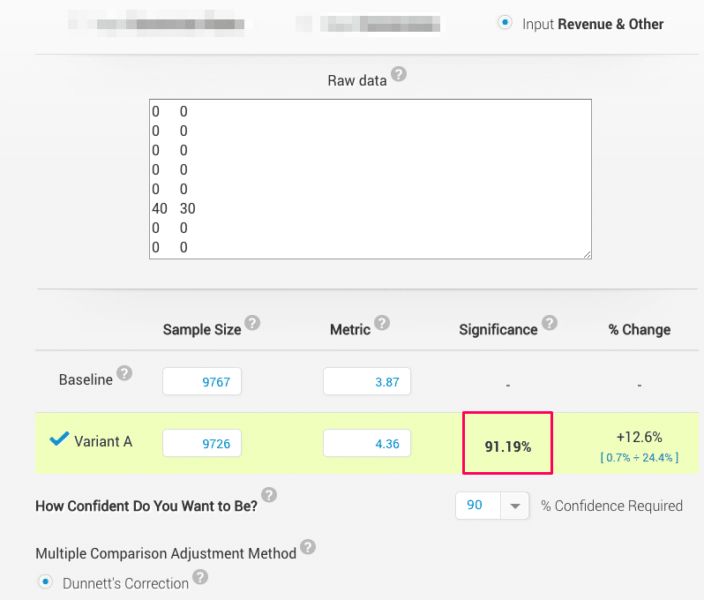
This calculator yields a 91.19% significance level for the test data. If we were to look at only this significance calculation, the test results appear promising. In fact, if your team uses a 90% statistical significance threshold you may even decide to make a business decision to move forward with implementing the test variation.
If we assume that all revenue calculators are the same, then we should see a similar significance level with the Blast Revenue Per Visitor Calculator since we’re using the same exact test data.
Blast RPV Calculator (Mann-Whitney U Test)
According to the RPV Calculator, the same test data resulted in only 73% statistical significance!
Even if your team had the same 90% statistical significance threshold these results are not even close to significant. In this case, your team would likely decide not to take action to implement the variation. The example above illustrates the real risk your team may encounter if you use an A/B testing calculator that needs to bend data in order to use an “easier” test instead of sticking with an approach that’s meant to handle non-parametric data, like revenue.
The Blast RPV Calculator may not be considered as “easy” as a cut and paste solution, but formatting the CSV file (with one column of user level revenue for the control, and one column of user level revenue for the variation) isn’t too difficult.
More importantly, a slight difference in the ease of use should not serve as a roadblock to obtaining quality results your team can depend on.
One other benefit of using the Blast RPV calculator is that it’s a one stop shop since it works for testing both normally distributed data as well as non-parametric data, and it is not limited to datasets being the same length. The Blast Revenue Per Visitor calculator does offer flexibility as it can work for a whole range of different formats of data. It is compatible with both comma delimited, period decimal data, as well as the semicolon delimited comma decimal data that is commonly found in some European countries.
When tests exist (ex. non-parametric tests like Mann-Whitney U) that maintain the rigor of the statistical significance calculation, it would make the most sense to rely on calculators that adhere to these methodologies.
Statistics Simplified
We’ll quickly explain how one would approach a normally distributed sample. Hopefully your team will be able to see why you shouldn’t use this on skewed data, and how we accommodate for the lack of parameters.
If there are two sets of normally distributed data, the method for finding out if they are different or not is called the t-test. For the t-test, you’ll need to find the average (mean) of each set of data, subtract those averages, and divide them by their standard deviations divided by the square root of the sample size. You’re probably scratching your head right about now, so I’ll go into a bit more detail below.
 With a t-test we want to figure out if the average of sample 1 and the average of sample 2 are significantly different enough that they would yield a large number when differenced, or subtracted from each other.
Chances are, if it’s pretty big, then they’re probably different.
We use standard deviation to adjust for the spread of the data, and sample size as a way to add rigor to our calculation. So, if Sample 1 has an average of 100 and Sample 2 has an average of 10, with both of them having enough data points present to tell us how tightly distributed each sample is, we can draw a pretty good conclusion that they’re different.
For a non-parametric set of data, our average may not be in the center of our data, and our spread is hard to determine because it would not be even on either side of the mean.
A workaround for this would be to not use the mean and variance, except now we can’t use the t-test. Instead, we can use the values themselves to compare across samples. That’s exactly what all the non-parametric tests do and the method Blast’s RPV calculator takes advantage of.
The t-test’s non-parametric equivalent, called the Mann-Whitney U/Wilcoxon Test, relies on using a ranking system to compare two samples. It works by combining all the revenue values of the two samples into one vector, and rearranging them into ascending order. It then separates them again, remembering the “rank” of each value, and tests the difference of the two samples using that rank.
Quick Example:
Sample 1: 2, 3, 4, 5 Sample 2: 2, 7, 8, 10
Combined Vector: 2(1), 2(2), 3(1), 4(1), 5(1), 7(2), 8(2), 10(2)
Ranks: 1.5(1), 1.5(2), 3(1), 4(1), 5(1), 6(2), 7(2), 8(2)
Sample 1 Rank Score: 1.5 + 3 + 4 + 5 = 13.5
Sample 2 Rank Score: 1.5 + 6 + 7 + 8 = 23.5
Using the Rank Score for each sample, we could determine which sample is larger, or if they’re too close to distinguish.
So, what exactly is going on here?
Well the first thing to notice is we use EVERY data point. No aggregation or parameters. As a basic explanation, we combine sample 1 and sample 2, and ensure we remember which sample each value came from. We then order them, in this case from 1 to 8, and use .5 to account for any values that are the same across both samples, or as they’re formally known, “ties.” Then, using that order, or rank, we add together all the rank values for each sample, and produce a score.
Understand Differences in Statistical Significance Calculators
If your team relies on test results to make important business decisions, it is essential to have a better understanding of the tools (i.e. statistical significance A/B testing calculators) that your team is using to analyze results.
Not all revenue calculators are the same. Some may be considered “easier” because of user-friendly features like cut and paste options; however, there is likely to be a trade-off, mainly the potential impact to the rigor of your test results.
The Blast RPV Calculator uses the Mann-Whitney U test to calculate significance for revenue because we understand that revenue is in fact abnormal. When there already exists a non-parametric test that’s perfectly suited to work with this type of data, there is no need to twist and bend your data to make it work with a t-test, which is meant for normal metrics.
As shown in the previous example, statistical significance calculations can be different even for the same set of test data. Since the RPV Calculator is using the test that’s meant to calculate significance for metrics exactly like revenue, it provides a higher level of rigor in the calculations compared to the “easier” A/B testing calculators.
There are a lot of good alternatives out there, and we encourage you to find the one that fits your team’s needs. If you’re dealing with non-parametric data, such as revenue from an e-commerce business, we strongly recommend you dive deep and get a better understanding about how that specific test works. The RPV calculator is designed to provide accurate insights, avoid false positives, and enable you to take action on those insights using the best method possible.
If you’re interested in a more in depth breakdown of the different non-parametric tests, be sure to keep an eye out for our upcoming white paper regarding this topic.
“I think you are doing a great job by helping people [make] educated decisions and not just [showing them] nice looking graphs!” – Blast RPV Calculator User Click & Tweet!
Related Insights

Digital Analytics


If you have questions or you’re ready to discuss how Blast can help you EVOLVE your organization, talk to an Analytics Consultant today.
Call 1 (888) 252-7866 or contact us below.


